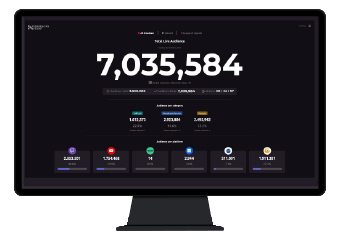
Sight

Improving products performance and strategy through data

Technology as a center of solution Data Ecosystem
Sponsors and partners Performance
Automatic measurement of Metrics and impact
  • brk-wb-sight-ecosystem-audience.svg

    Audience

    Capturing the information in real time of your audience behavior, origin and performance.
  • brk-wb-sight-ecosystem-brand.svg

    Brand Detection

    AI and ML at the service of the analysis of brand exposure on your screen.
  • brk-wb-sight-ecosystem-segment.svg

    Segments

    A breakdown of your product structure to analyze and improve the core.
Creating an environment where everyone can live and enhance the decision making process regarding product strategy and commercial relationships.
bg-constructor.png
  • brk-wb-sight-performance-track.svg

    Track

    Data to tell your product story, growth and behavior during time.
  • brk-wb-sight-performance-analyze.svg

    Analyse

    Information in order to improve the data-driven decision making process.
  • brk-wb-sight-performance-visualize.svg

    Visualize

    Comprehensive dashboards and categories to communicate the information.
Knowing how your products perform and why is the first step into a continuous improvement process and data is the fuel.
  • brk-wb-sight-metrics-report.svg

    Reporting

    Show the impact directly to partners and stakeholders with individual reports.
  • brk-wb-sight-metrics-evidence.svg

    Evidence

    Automatic capture of video moments for every appearance or exposure.
  • brk-wb-sight-metrics-visibility.svg

    Visibility

    All areas gathered in the same place with powerful information.
Making your data communication accurate and simple to read will allow partners and stakeholders base their decisions in data.
Do it yourself drive your growth and improvement
Knowledge is power Transparency

Data Breakdown

Analyzing each one of the appearances independently.

Credibility

Demonstration to your partners that the presence is real.

Accuracy

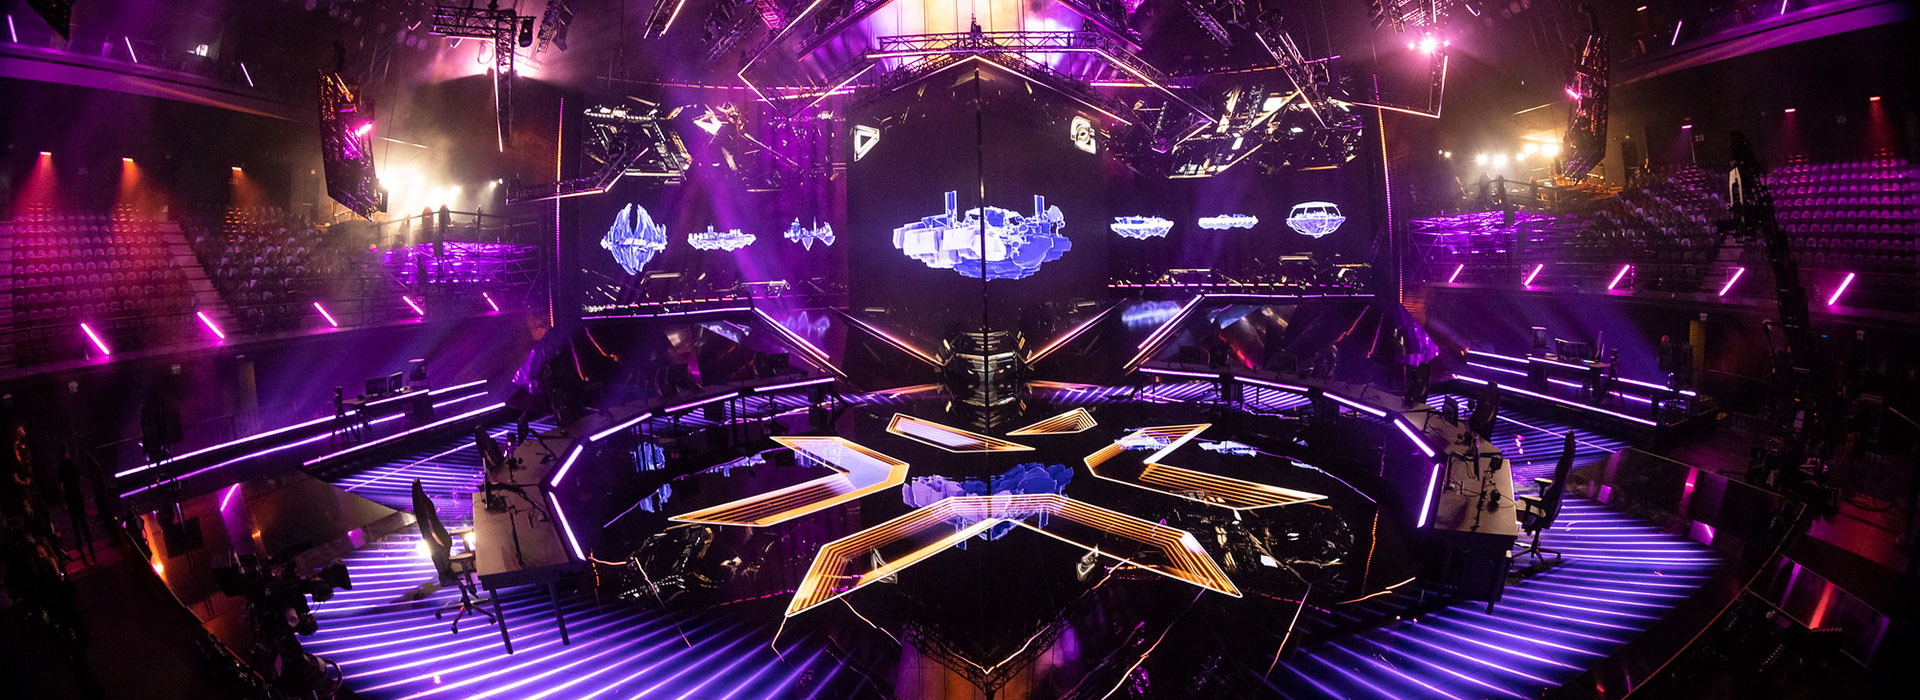
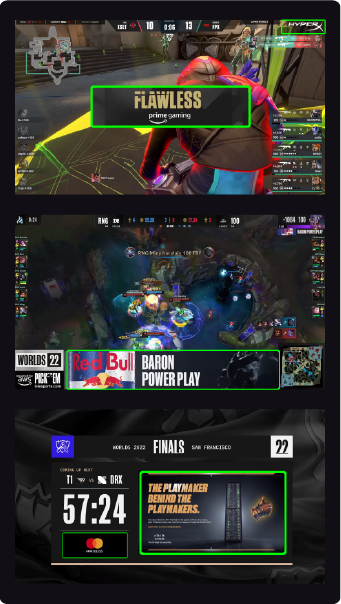
Know exactly when, where and what is being broadcasted.

Automated

the report is automated with video timestamps and data.

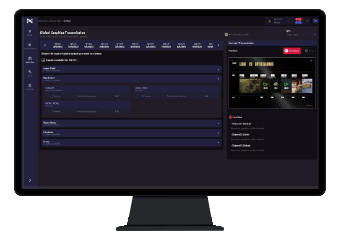
We mix different data layers and sources to create an automatic measurement of your performance during live shows.

stats
Do it yourself Real time Audience

Inside Broadcast

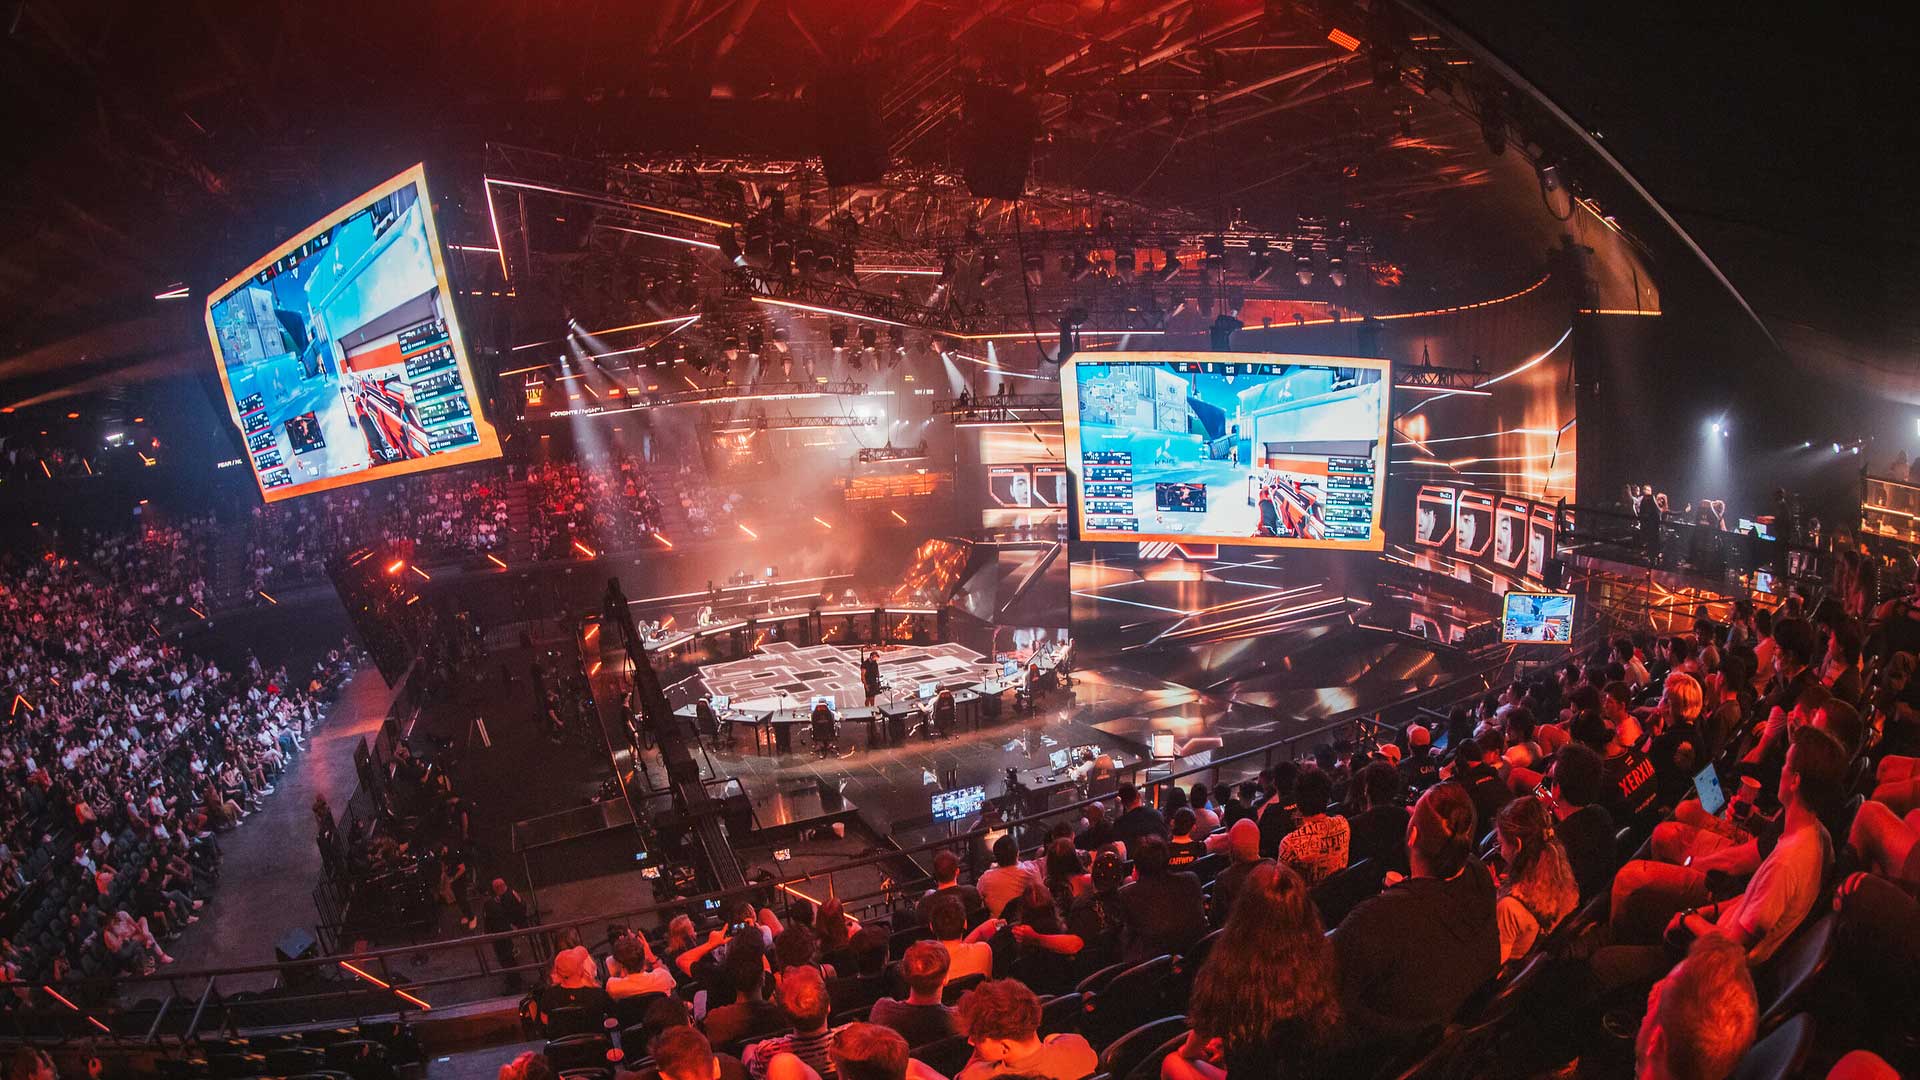
Tracking and measurement of every single appearance in all broadcast/product instances. Wether they are physical elements in the studio, or digital assets within the game.

Outside broadcast

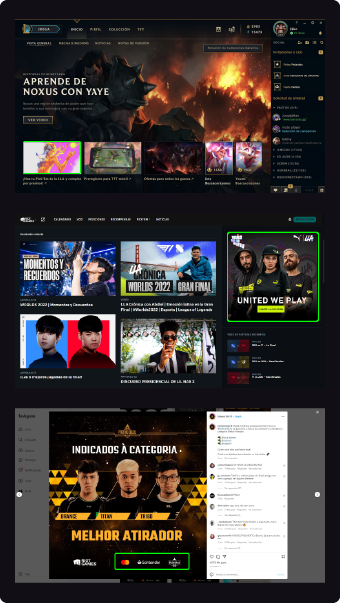
Measuring assets that exist as a part of an activation or campaign but they don’t appear on the main broadcast like social media, websites, blogs, etc.

Do you want to know your impact?
Sight download report Sight: Audience Analysis in Gaming

Fill the form and we will contact you

You can track your brand’s visibility in live broadcasts from any brands’ website or app. This gives you the tools you need to monitor, analyze, and contextualize your ads in real-time.

PARTNERS

"Not only does Barracks provide cutting-edge broadcast graphic solutions that speak authentically to their audience, but their passion and customer support is Second to None."

Brett Brielling

Broadcast Producer Global Events

"We are grateful to have Barracks as a partner, as their dedication to innovation and pushing boundaries aligns perfectly with our goals of delivering the best possible experience to our viewers."

Fernando Svevo

Broadcast Manager Brazil

"The difference is, Valorant is broadcast in over 20 different languages using multiple simultaneous control rooms all over the world. Something like that is only possible using Barracks."

Michael Di Giovanni

Graphics Operator
brk-wb-home-testimonios-background-1-1.jpg

Our products

Controller

The way to scale the broadcast operations around the world starts with flexibility.

Sight

Enhance the decision making process regarding your product strategy with accurate data.

other-products-bckg-web-optm.jpg